Loading
Metric
Date filter
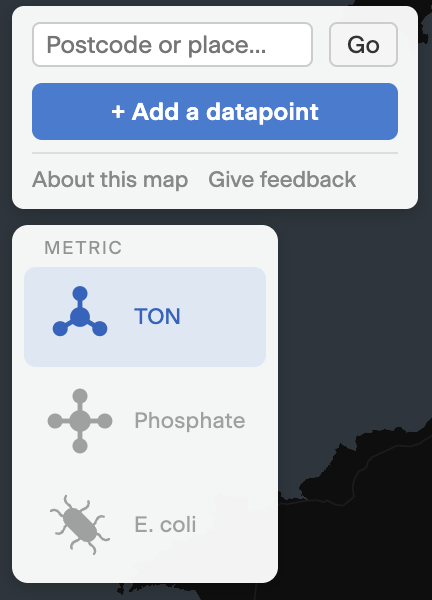
You can search for a particular point of interest or a postcode. You can also select a different metric from the metric window to display national water quality data for Total Oxidised Nitrogen, Phosphate and E. coli.
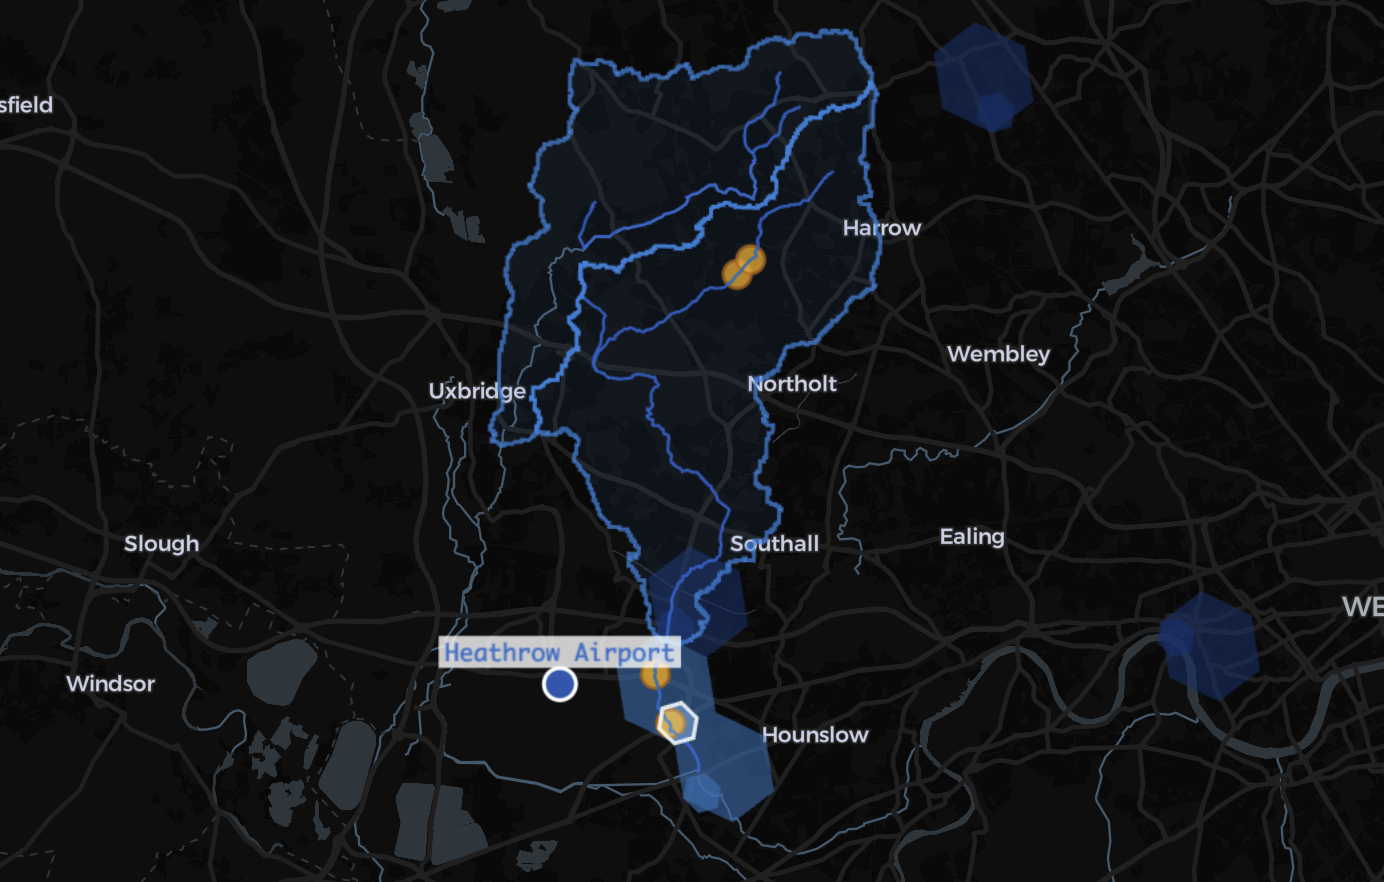
Sampling site
Catchment
Upstream rivers
Rainfall station
Sewage outfall:
Discharging
Recently discharged
Not discharging
Each hexagon aggregates water quality samples from that area. Zooming in shows more detailed water quality data for specific sampling sites. Click a hexagon to explore.
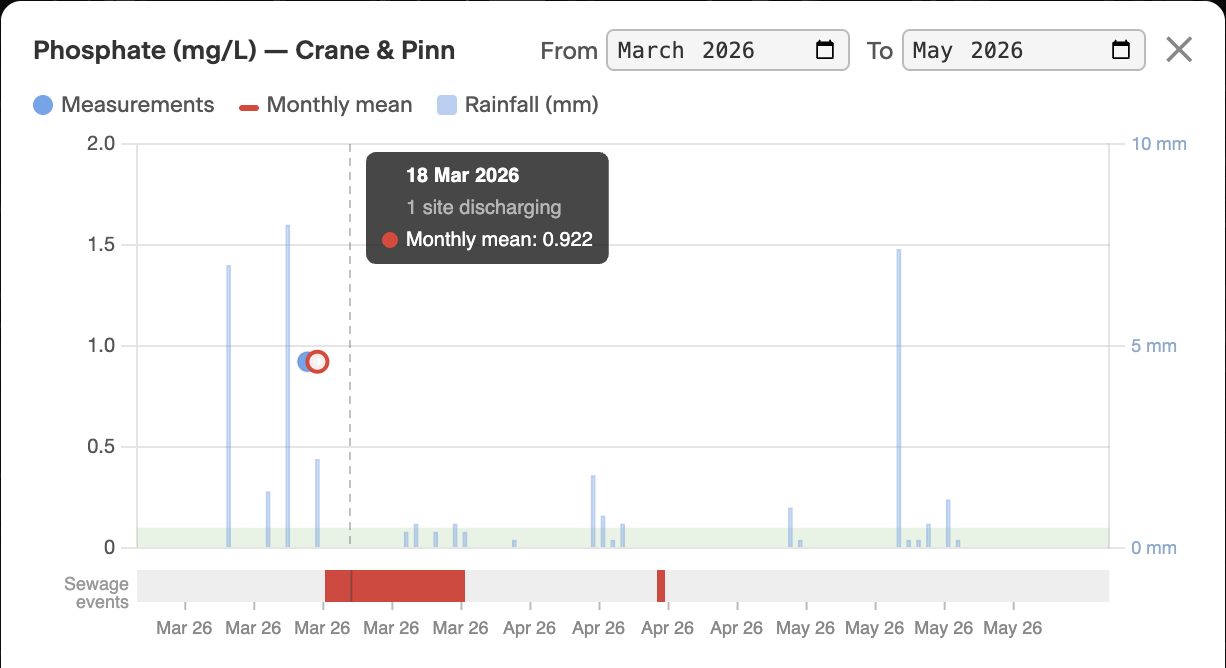
See individual measurements alongside daily rainfall and upstream sewage discharge events, helping you understand what is driving pollution. Ideal target values for each analyte are shown and highlighted on the graph. Hovering over a sewage discharge event highlights the corresponding outfall site on the map.